The Link Between Market Volatility and S&P 500 Rallies
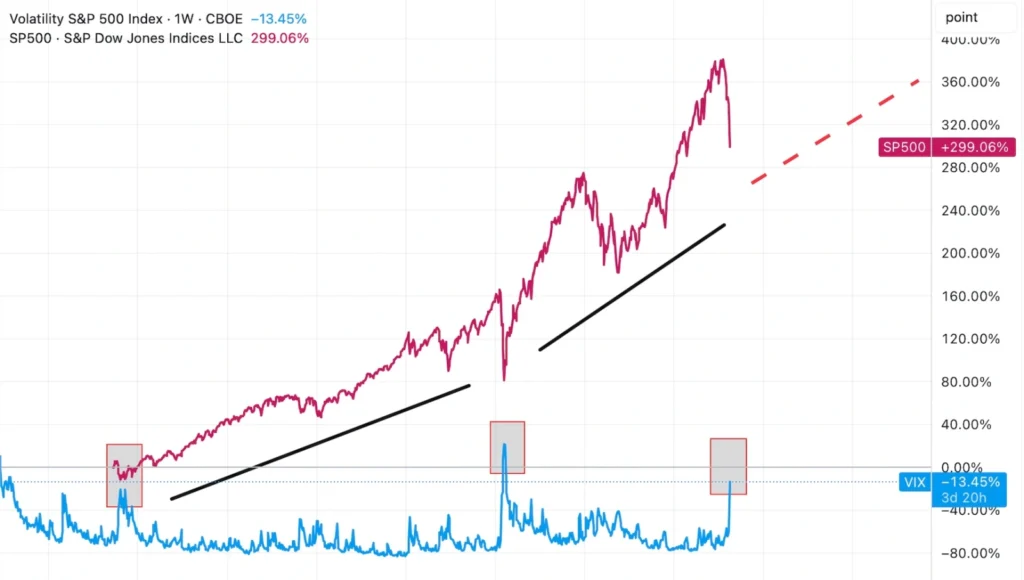
Historically, sharp spikes in market volatility—measured by the VIX (Volatility Index)—have often coincided with significant market bottoms in the S&P 500, setting the stage for strong rallies. The chart above clearly illustrates this recurring pattern.
In 2011 and again in 2020, dramatic surges in the VIX aligned with steep but brief declines in the S&P 500. These moments of heightened fear were quickly followed by powerful rebounds, as investor sentiment stabilized and economic conditions improved.
2025: A Potential Turning Point for the S&P 500?
We appear to be witnessing a similar setup in 2025. After a recent spike in the VIX, which echoes past episodes of market stress, the S&P 500 has pulled back sharply. However, if history is any guide, such spikes in volatility tend to mark turning points rather than prolonged downturns.
With the longer-term uptrend in the S&P 500 still intact and past instances of volatility-driven pullbacks followed by strong rallies, the current environment could present another opportunity for a rebound—much like those seen in previous cycles.
Get in touch with one of Astra Worldwide International Financial Advisor Here
🌐www.astraworldwide.com
📧[email protected]
📲WhatsApp :+639933478879
Discover insights and promising funds during down times
Old is Gold: Back to the Old with Astra Worldwide | Bowmoor & Sanlam Funds Outperform S&P 500 |